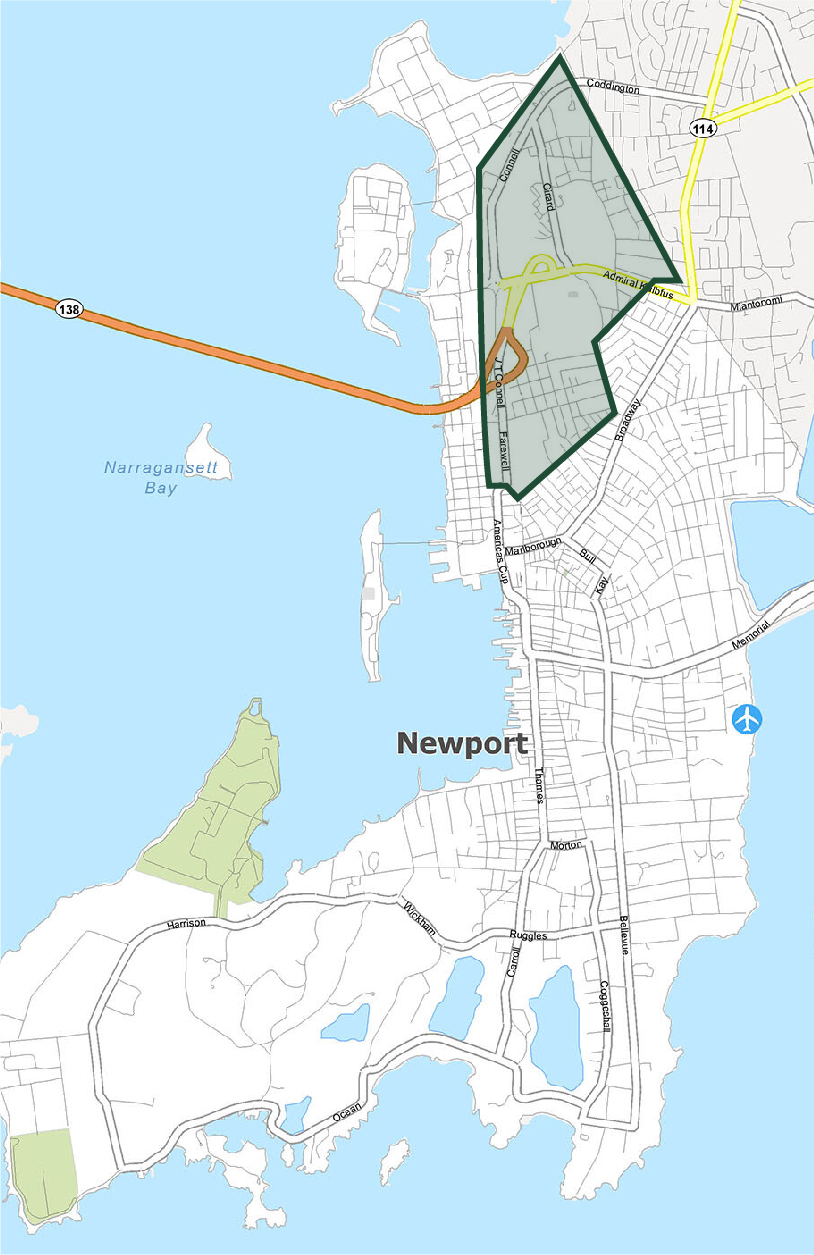
POLICY MAP
See reports on investments and housing characteristics by the following geographies: Statewide, Congressional District 1, Congressional District 2, State Senate District, State House District, Municipality.
Interactive Mapping Tool
- Users can generate an interactive report summarizing RIHousing programs, demographic trends and housing conditions in their community.
- Users can explore current information and historical trends and see how their community compares to the rest of the state.
Instructional Video
Purpose of this tool
- Engaging with legislators: Our primary goal was to provide a new way for state and local legislators to explore our impact on their district. By combining our program data with demographic and housing data, we can demonstrate how our programs are meeting constituents’ needs.
- Communicating with partners & public: The tool is a valuable resource for our partner organizations and community members as users can explore a wide range of data and create a snapshot of their community’s housing needs.
- Informing our program planning: This tool allows RIHousing to quickly assess how our programs are distributed across the state, and how they align with local housing needs. This insight will strengthen our internal program planning and evaluation.
How to use this tool
- Choose data: Click the orange “New Map” button in the top left corner to choose what indicator to show on the map.
a. Click the small “I” on the top toolbar to see the source information for the dataset.
b. Expand the legend on the right side to see additional options for visualizing the dataset.
- Choose geography: Click the “Shaded By” tab on the top toolbar to select what geographic level to show on the map. Choose from block group, census tract, ZIP, county subdivisions (municipalities), Rhode Island House & Senate districts, and Congressional districts.
- Choose a location: Click any area on the map to see data values and report options for that specific location.
a. Alternately, use the search bar in the top-left to find a specific address, ZIP code, or district.
- Generate a report: Using the pop-up menu, choose which area to include in the report. Hover over the data and graphs in the report to learn more.
*Note that not all datasets are available at all geographies.

