HOUSING INDEX
The RIHousing Index is designed to describe overall market health, taking into account a variety of factors including available supply, development activity and demand for housing.
These are:
1. Foreclosures in process
2. Construction employment
3. Median single-family home sale price
4. Single-family home sales volume
5. Average asking rent
6. Housing starts
7. Rental vacancy rate
8. Unemployment rate
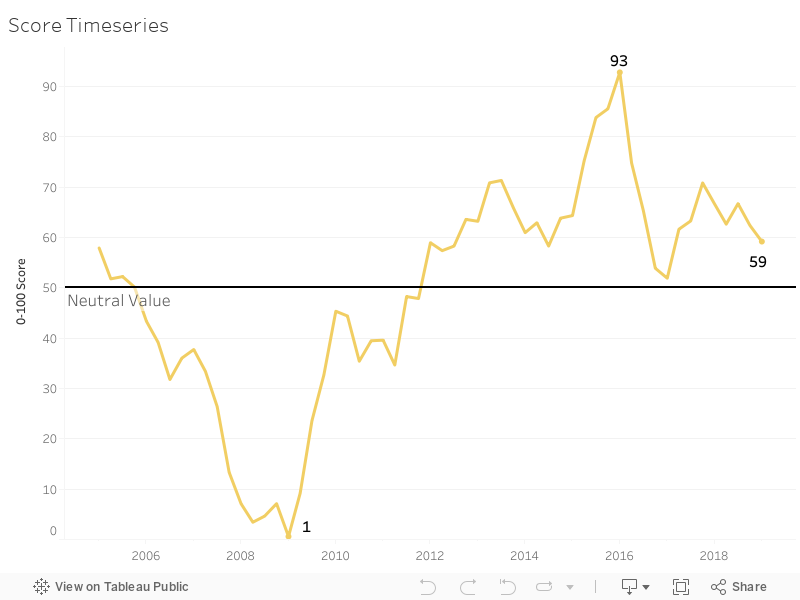
These metrics are all converted into year-over-year percentage change values for each quarter. The quarterly index value from 2005 through 2019 is shown below.
How to use it?
The Index is given as a value between 0 and 100, which indicates the year-over-year change of eight variables. It offers an easy to understand, comprehensive indicator of supply and demand that can be calculated 4-6 weeks after the end of the quarter. If the index value is above 50, overall housing market conditions have improved from the same period a year prior.
Looking at the chart above, we can see the index value dropping below the neutral value of 50 from Q4 2005 to Q1 2006. This was driven primarily by a spike in foreclosures and a sharp drop in home sales, along with stagnation in several other variables. These trends continued over the next several quarters, eventually leading to the collapse of the housing market, which took until 2012 to begin recovery in earnest. The lowest value of 1 was reached at the beginning of 2009. This does not mean that the housing crisis was at its worst point at the beginning of 2009, but that the market experienced its fasted period of decline. Decline continued through Q4 of 2011, as measured by the index, as index values remained below 50 during this period.
Since then, the recovery slowly accelerated between 2012 and 2016, making up much of the ground that had been lost since 2005. After crossing the neutral threshold of 50 in Q1 of 2012, the index largely remained above 60 and had 6 quarters above 70, signaling rapid expansion, reaching its highest value of 93 in Q1 of 2016. The period from 2016 through 2019 has been marked by stability, with index values generally falling between 60 and 70.
